We are going to dive a little deeper into Canva and learn how to use it to make infographics. You might have noticed that infographics are everywhere these days. They are eye catching, shareable, and easily digestible. They are great in this age of short attention spans. Making an infographic takes more time and planning than a traditional blog/social media image, but Canva can help with the design portion.
First thing to remember before you get started is that Canva is a tool. You will still need a good design sense, solid data, and good grasp of your audience before you start your infographic design. An infographic is a great method for telling a story using facts and research.
Once your plans are in place it is time to start visualizing! It might even be a good idea to start with a sketch of what you have in mind before jumping into Canva.
Getting started:
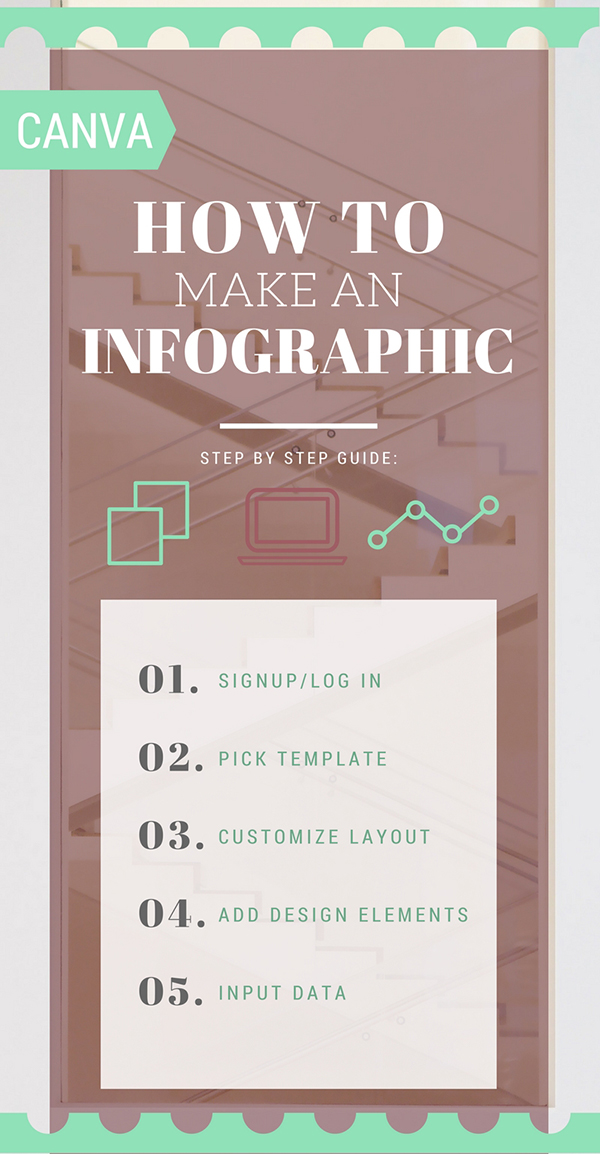
1. Sign up/Sign into your free Canva account.
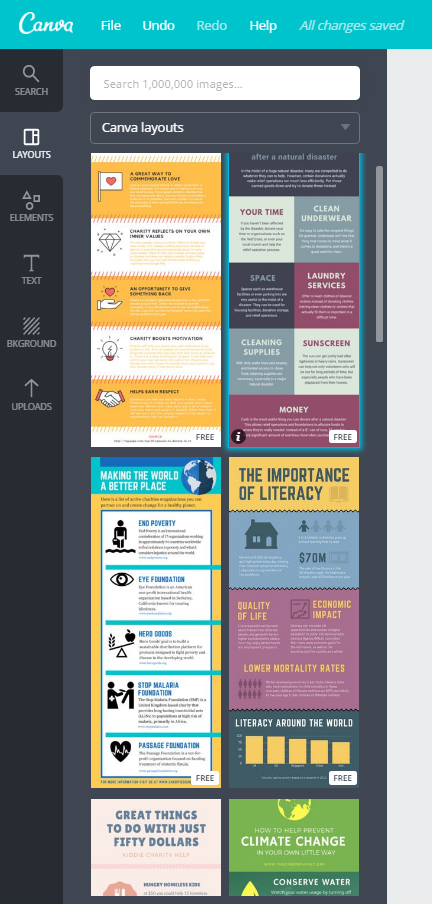
2. Pick out a infographic template or create your own. Canva has a lot of infographic templates you can edit and use, but it is also easy to make a custom sized infographic to fit your needs (their standard size is 800px X 2000px).
3. Pick a layout for your design – change your background or upload one of your own – it is also very common to break your design down into horizontal data sections.
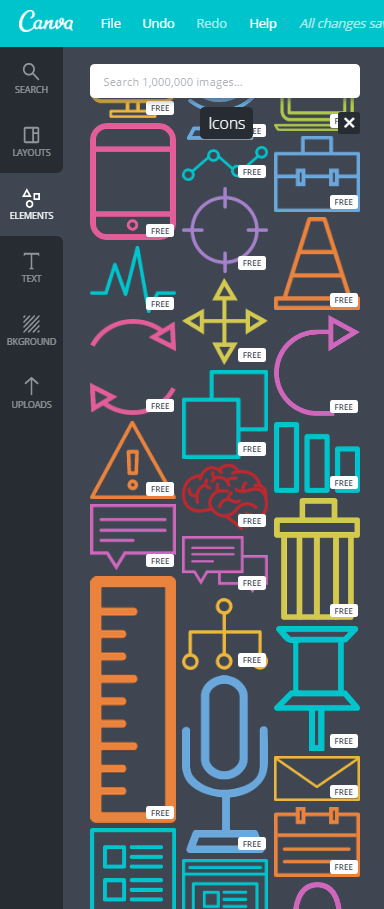
4. Use the Elements tab on the right to place any graphics, lines, shapes, grids, or illustrations you would like to use in your infographic to help tell your story.
TIP: Infographics look best when they have a limited color palette – color theory can get complicated so if you don’t have a strong sense for color try sticking with a monochromatic color scheme to start.
5. Make sure your data makes sense and your chart is understandable – as with color the best infographics have limited font choices. Sticking with 2 different fonts is a good place to start – one for headings and one for body text (aim for readability over looks).
6. When you are all done with your design, click the Download button at the top of the window and your design will be downloaded to your computer. It is now perfect for sharing or posting on your blog!
What are some of your favorite tools for making infographics?
{images from here}


Adam
March 1, 2017 at 10:05 am //
Succinct and helpful. Your blog post is like a good infographic!